How to better understand user behavior with Microsoft Clarity?
A reliable and informative online presence is crucial if you rely on a website to attract customers. However, creating a website is hard work. Even if you use a website builder or a CMS like WordPress, the process might still not be easy. You can spend weeks creating your website layout, writing marketing content, and completing offers. But once your website is live, how do you know that your customers will have a good experience with it? How do you know if they can easily find the necessary information and don’t confuse some layout images for buttons?
In addition to providing a visually appealing layout, it is critical to use supporting web analytics tools to determine your customers’ actions on your site. There are plenty of them including scrolls, clicks, mouse movements, and time spent on pages, etc. Tracking these actions will help you understand your customers’ behavior and highlight any problems with your website.
We all use Google Analytics mostly to read a website’s numbers and track some conversions. But how do you understand what influences those numbers? How can you tell why one page performs better than another? Numbers alone are sometimes not enough.
Can you dig a bit deeper with your website analytics? What if you could see what your customers actually do on your website through their mouse movements and clicks?
Is that even possible? Of course!
Let me show you what we use daily at Calendesk and how we try to improve our landing pages and application with Microsoft Clarity.
What is Microsoft Clarity?
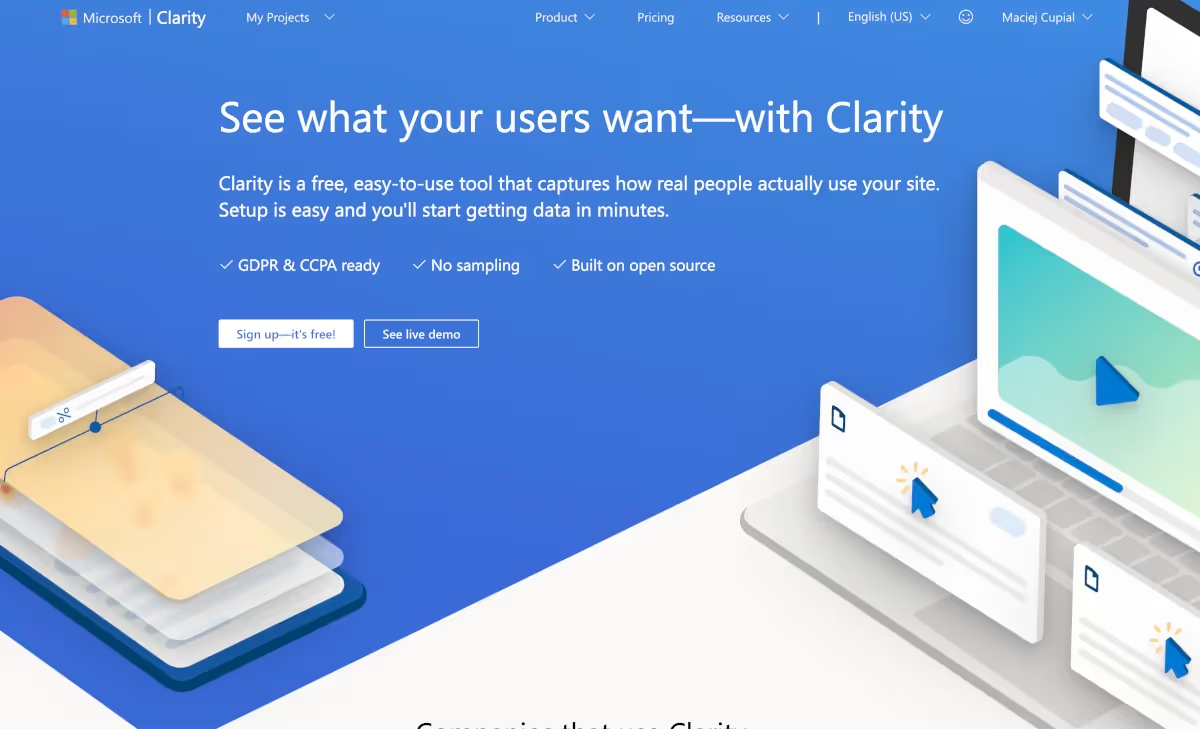
Microsoft Clarity is a free analytics tool focusing on user behavior to help you make sense of how people interact with the features of your website. It complements Google Analytics and provides user insights through tools such as heatmaps and session replays. It’s possible to get started with Clarity in just a few minutes to see how your visitors are using your website, what clicks for them, and what does not work well.
Why use Clarity?
It allows you to track user behavior on your website close to real time. See where people click, what they ignore, and how far they scroll.
Explore what’s working, learn what needs to be improved, and test out new ideas.
Discover where users get frustrated.
It’s completely free. Similar tools on the market can cost a few hundred dollars annually.
It doesn’t slow down your website performance.
It offers unlimited traffic, unlimited heatmaps, unlimited websites, and unlimited team members.
It has Google Analytics integration.
It takes care of data collection and anonymization.
It is completely safe and GDPR compliant.
Where should I start?
Go to the Microsoft Clarity website and create a free account. Once you sign up, Microsoft Clarity will show you what to do step by step. The app is very intuitive and has a perfect onboarding process, so you will not feel lost.
After signing up, you should connect your website with Clarity. To do so, you need to copy and paste a unique code directly to your website to integrate with Clarity, allowing it to track your website. Additionally, you can use Google Tag Manager to install a new Clarity tag in just a few clicks.
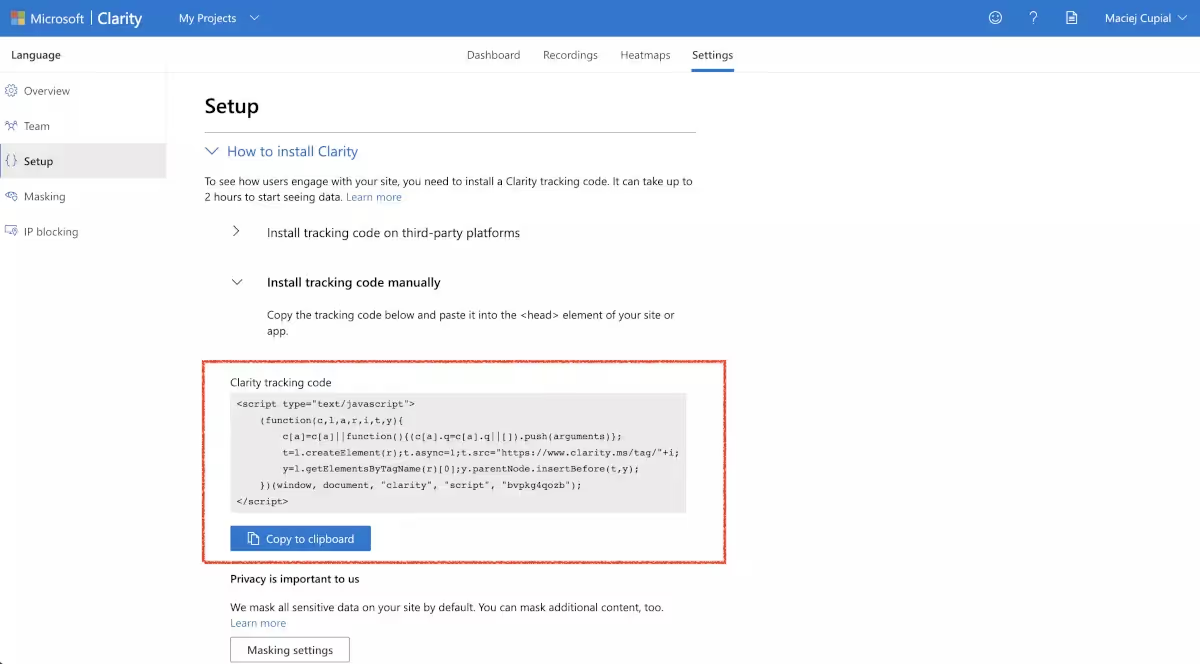
Check out our help article, "How to add Google Analytics, Facebook Pixel, and other custom scripts to Calendesk?" to see how to do it in Calendesk Website Builder.
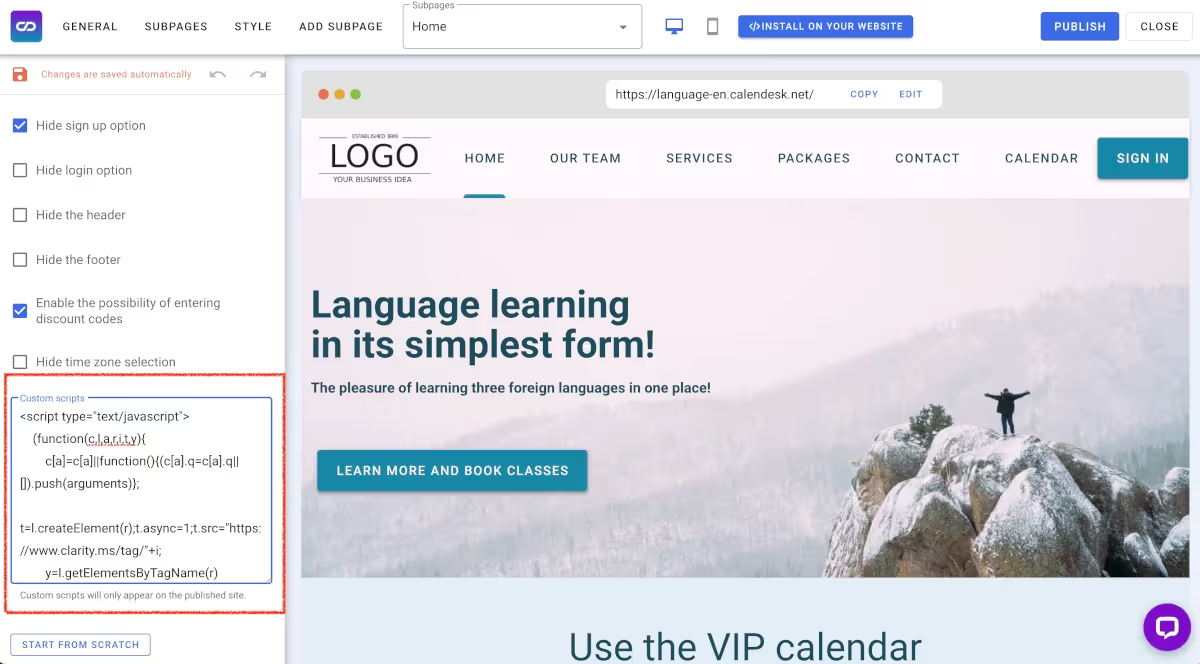
After installing, it may take up to two hours until you see some results in the Clarity dashboard.
Microsoft Clarity Features
Instant heatmaps
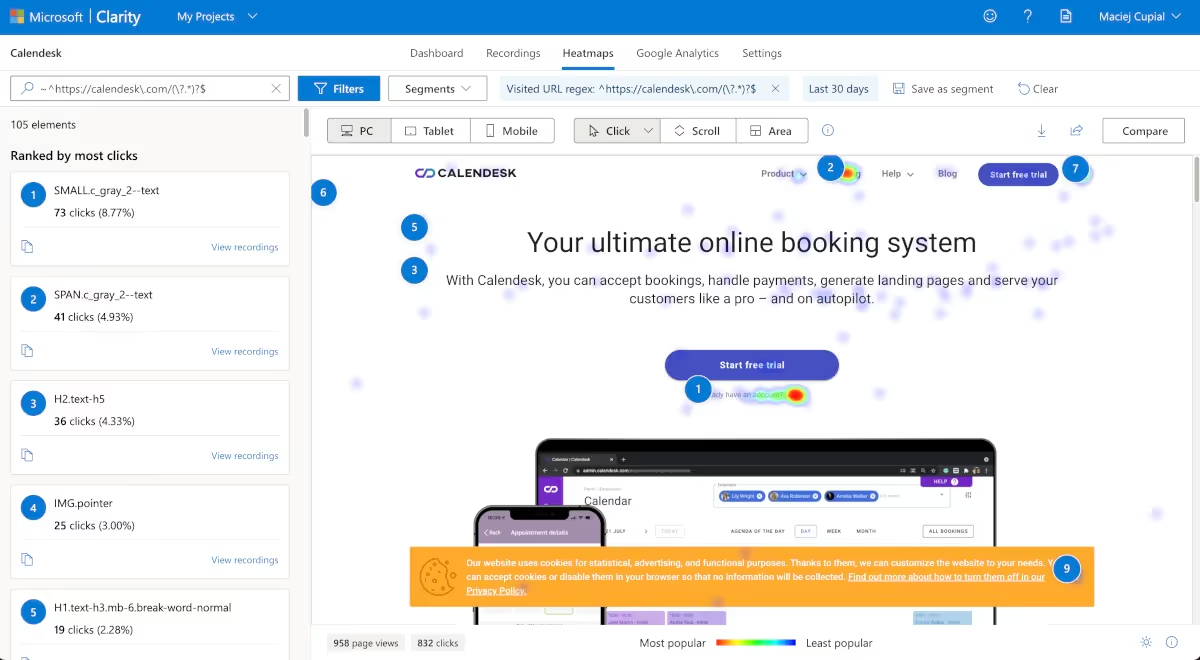
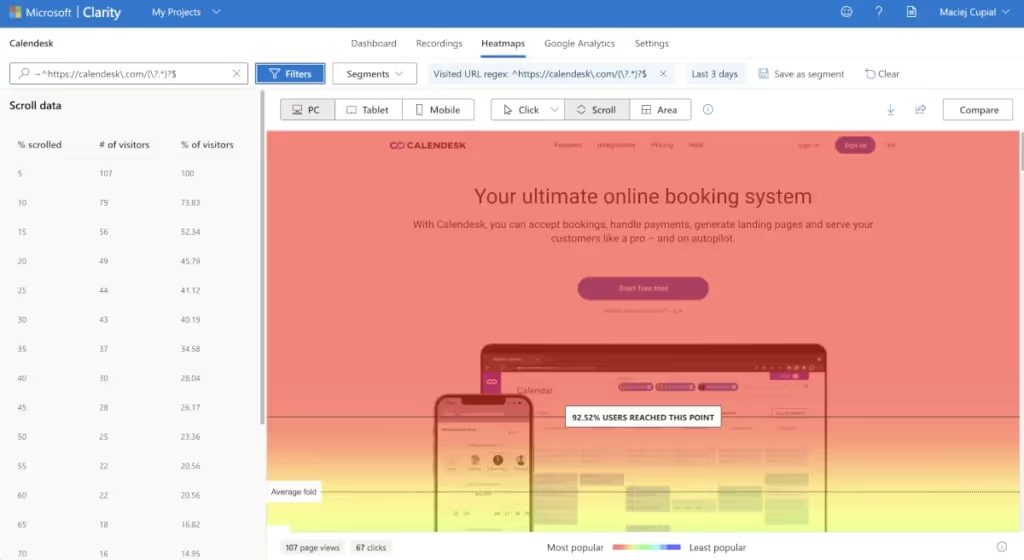
Clarity helps generate heatmaps and shows you what users are doing on each page. Clarity’s heatmap tools record exactly where your users click and allow you to explore or even filter the data. Thanks to this feature, you can better understand what your users want or what kind of problems they may have with your design.
You can display heatmaps for desktop, tablet, and mobile versions, letting you explore behavior by different devices. The scroll option helps you visualize how far your users navigate down a page. Additionally, the Area tool shows you the total clicks within an area on the element you choose.
Compare two heatmaps side by side
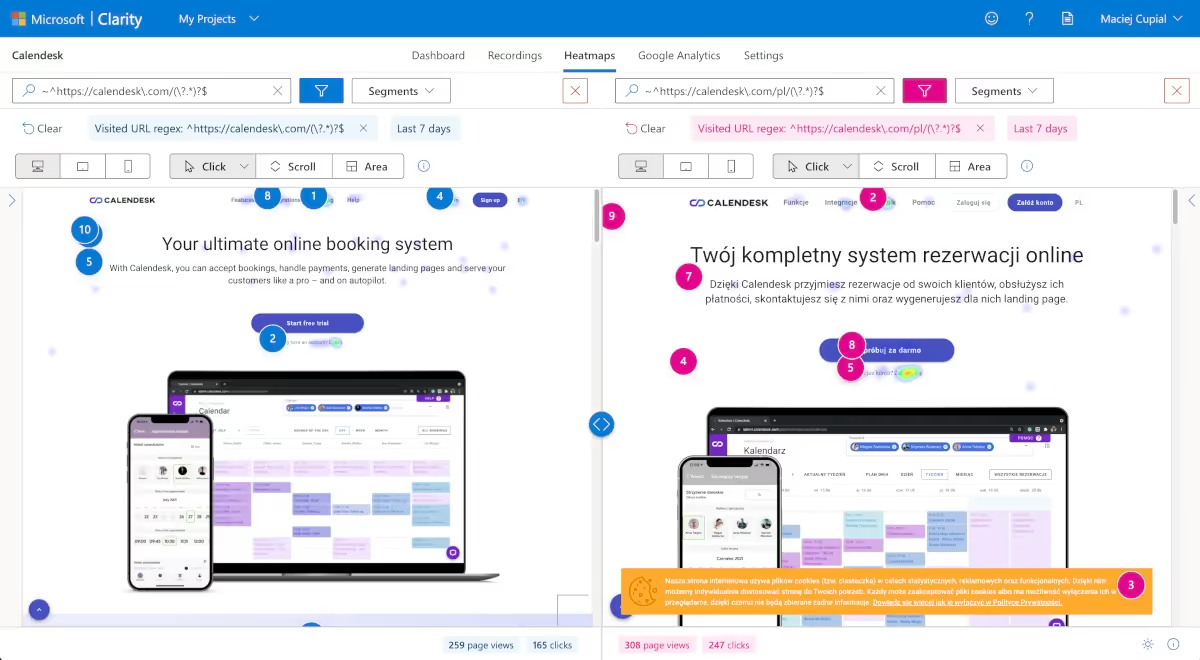
Clarity allows you to compare two heatmaps side by side. Thanks to this feature, you can analyze two versions of the same page and see where users click and scroll. In addition, comparing two website versions helps you explore how behavior differs between user segments, time frames, and other applied filters.
Share heatmaps with your team or clients
What’s really cool is that you can share heatmaps with your team or clients. Create a public link and send it to them.
Calendesk case: How did we improve the Calendesk landing page with Clarity?
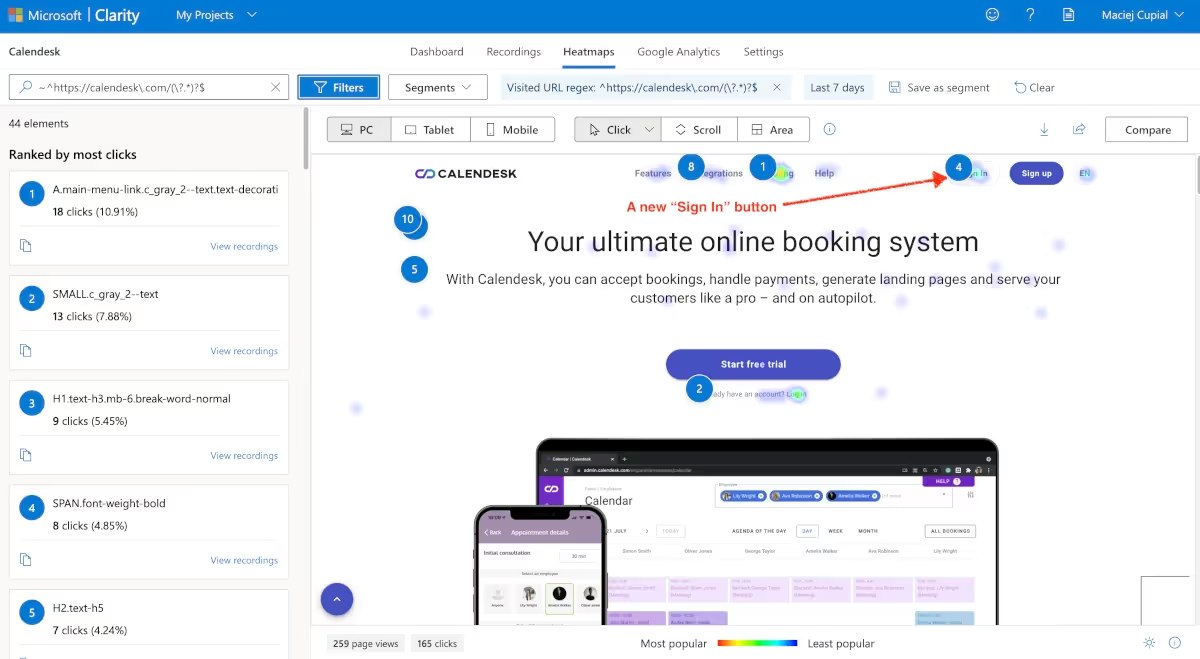
Recently we discovered that our customers needed a quick way to log in to the admin panel. It seems to be an obvious thing, but we completely ignored this before. We only had a simple “Already have an account? Log in” link under the main signup button. Some of our users didn’t even notice the link and used to ask us how to log in to the panel. Of course, we immediately improved this after seeing the issue. Adding a visible Sign in button at the top of the website was a good solution. Without Clarity heatmaps, we would not even know about this problem. This is just a small thing, so imagine how many of them we found in the Calendesk admin panel?
Session recordings
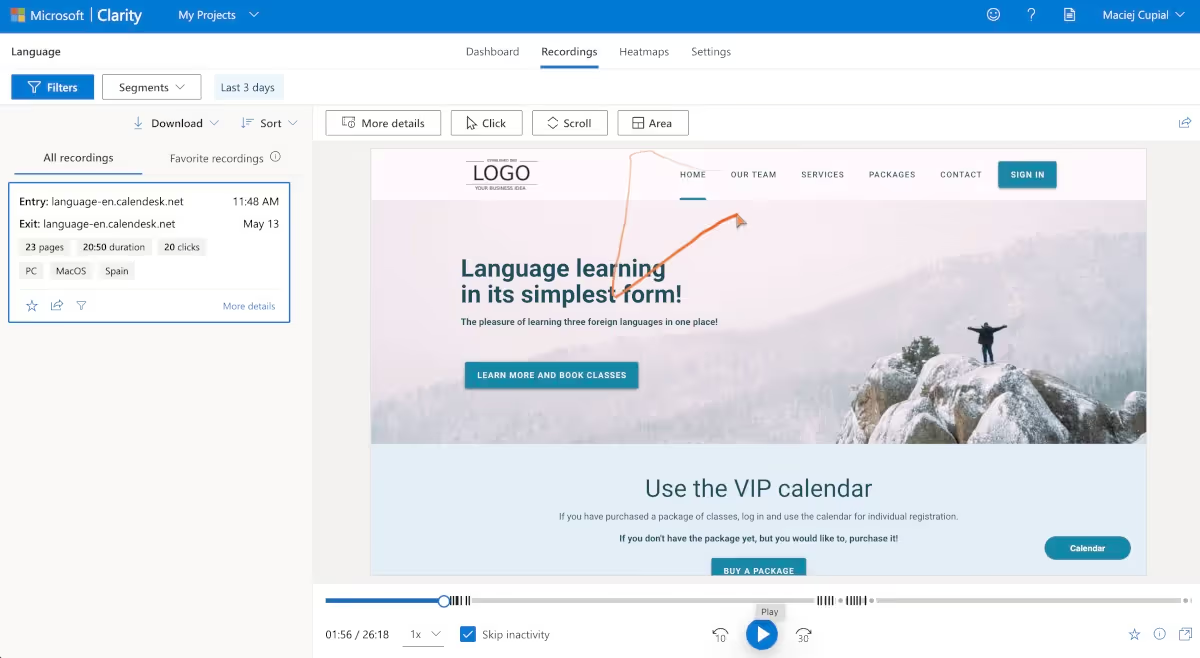
With Clarity Session recordings, you can go beyond the numbers to see how people actually use your site. This is one of the greatest features that we love at Calendesk.
Session recordings help you to experience what your users see. Thanks to this feature, you can watch how users navigate your site and when you lose them. Recordings are anonymous and of high quality. It’s possible to watch all recordings back at any speed and share them with your team or customers.
If your website includes tools to help users manage schedules, session recordings can reveal where they encounter difficulties, ensuring a smoother experience.
Additionally, Clarity helps you identify places of user frustration with insights like rage clicks and find product bugs that can damage the user experience.
You can watch all session replays in the Recordings tab. All user sessions are recorded, including mouse movements, scrolling, and clicks. Additionally, recordings include entry and exit URLs, session duration, date, and the type of device.
Powerful insights
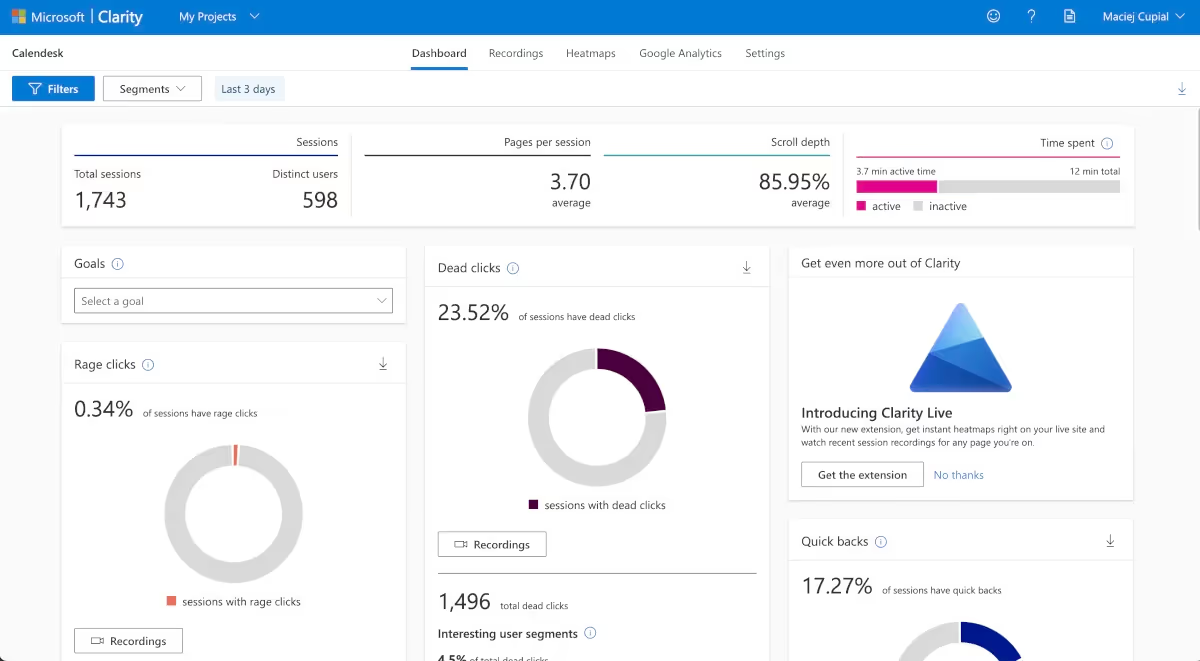
What if one of your important buttons doesn’t work and you don’t even know about it? What if your customers want to make an appointment and fail? With Clarity’s insights, you can track what really matters. Clarity helps you discover user frustrations. For example, quickly find out where users get annoyed and examine moments when they move to a new page but immediately return to the previous one or when they rapidly click and nothing happens. Additionally, try advanced filters to sort insights by device, browser, operating system, UTM campaign details, and location, or see your most popular pages and top referrers.
Clarity cares about developers too, so yours will probably love this tool. Clarity allows them to see what a user did before an error occurred, as well as find JavaScript and image errors.
Google Analytics
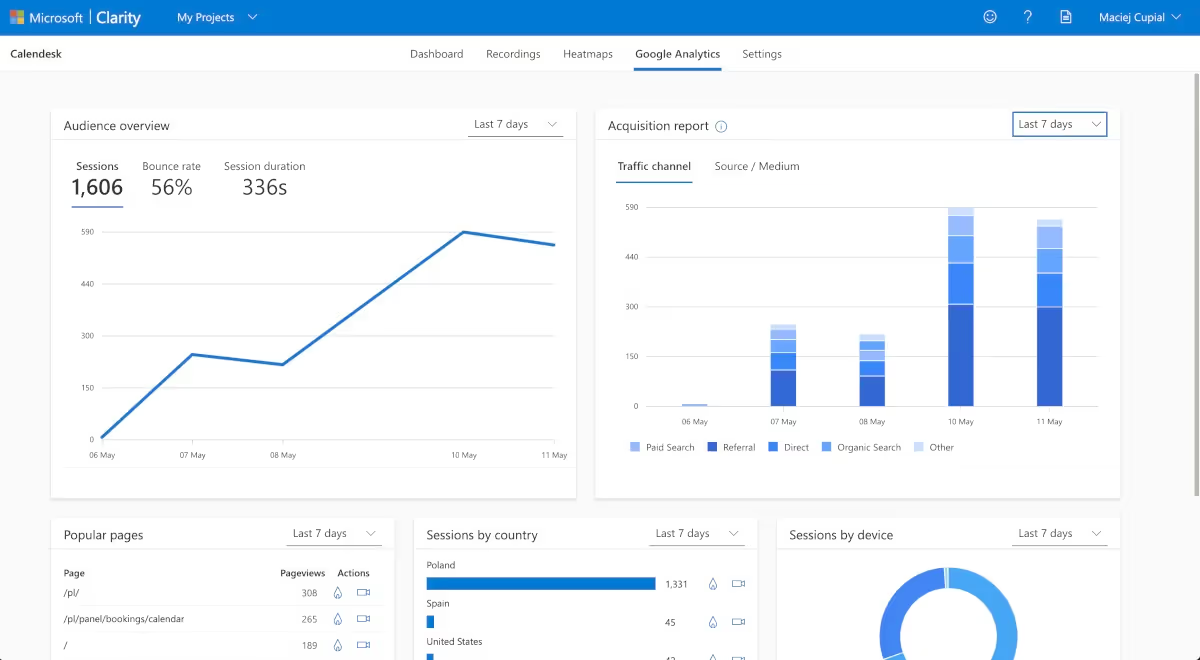
Good things come in pairs, right? Of course there are some similarities between Clarity and Google Analytics, but they aren’t competitors – they complement each other. Google Analytics measures traffic and e-commerce performance, while Clarity tracks similar metrics but also lets you see how users navigate and engage with your site.
Integrate your Google Analytics account and watch recordings for Google Analytics segments, then Clarity will automatically import your segments and allow you to use them as filters.
Thanks to its embedded analytics capabilities, you can see your Google Analytics metrics without leaving the Clarity dashboard.
Conclusion
Clarity brings a lot of interesting metrics to the table. Given how easy it is to get things up and running, and that the tool is entirely free, we recommend setting up an account and trying it out for yourself. We hope this article gives you some ideas for using Clarity to ensure the best possible experience for your site’s users. After learning about the benefits of Microsoft Clarity, will your business give it a go?


